 |
|
 |
Process Capability Indices |
| Process Capability Indices |
For variable control charts, it is often desired to include so-called process capability indices in the summary graph. In short, process capability indices express (as a ratio) the proportion of parts or items produced by the current process that fall within user-specified limits (e.g., engineering tolerances).
For example, the so-called Cp index is computed as:
Cp = (USL-LSL)/(6*sigma)
where sigma is the estimated process standard deviation, and USL and LSL are the upper and lower specification (engineering) limits, respectively. If the distribution of the respective quality characteristic or variable (e.g., size of piston rings) is normal, and the process is perfectly centered (i.e., the mean is equal to the design center), then this index can be interpreted as the proportion of the range of the standard normal curve (the process width) that falls within the engineering specification limits. If the process is not centered, an adjusted index Cpk is used instead. For a "capable" process, the Cp index should be greater than 1, that is, the specification limits would be larger than 6 times the sigma limits, so that over 99% of all items or parts produced could be expected to fall inside the acceptable engineering specifications. For a detailed discussion of this and other indices, refer to Process Analysis.
|
 |
|
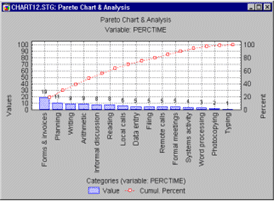
which simply amounts to a histogram showing the distribution of the quality loss (e.g., dollar loss) across some meaningful categories; usually, the categories are sorted into descending order of importance (frequency, dollar amounts, etc.). Very often, this chart provides useful guidance as to where to direct quality improvement efforts.
|
|
 |